
Uncovering true biological signals in raw sequencing data requires more than just running computational pipelines – it requires an expert understanding of the variables that can obscure the truth.
In this technical deep dive, Dimitrios Koumadorakis, Senior Bioinformatician at VUGENE, explains a critical nuance in computational oncology: why taking bulk RNA-seq data at face value can lead to misinterpretation, and how to properly adjust your models for accuracy.
Dimitrios specialises in leveraging machine learning and AI to solve complex biological problems. He holds an integrated master’s degree in Computer Science and Informatics from the University of Patras and is currently a PhD candidate in Bioinformatics at Ionian University. With over three years of research at BSRC Alexander Fleming and international experience as an EMBO Scientific Exchange Grant recipient at Heidelberg University, he brings deep, hands-on expertise in analysing single-cell, spatial, and bulk RNA sequencing data.
Written by: Dimitrios Koumadorakis
When tumour purity changes the story
Your bulk RNA-seq tumour sample is not just tumour. And that can change your conclusions. Sometimes, what looks like a clear biological difference turns out to be a little more complicated.
Recently, I was analysing replication stress in gliomas using TCGA bulk RNA-seq data. Replication stress occurs when cells encounter difficulties copying their DNA, and it can play an important role in cancer development.
I used the Repstress score (Takahashi et al. 2022), a 17-gene signature, and found that glioblastomas had clearly higher scores than lower-grade gliomas.
But then I checked the tumour purity.
Within glioblastomas, less pure tumours with more immune and stromal signals also had lower Repstress scores. And once I adjusted for purity, most of the differences between the classic expression subtypes disappeared.
How do we account for tumour purity?
I estimated purity with ESTIMATE (via R package tidyestimate), which scores each sample on the expression of stromal and immune gene signatures: the higher the score, the more non-tumour cells and the lower the purity. I included it as a covariate in a linear model (ANCOVA). This allowed me to compare groups while accounting for differences in estimated tumour purity.
But why use tumour purity rather than cell-type deconvolution? Because they answer different questions:
Tumour purity estimation (e.g., ESTIMATE) uses immune and stromal signals to tell you how much of the sample is tumour, as a single number.
Deconvolution helps us understand which non-tumour cells are present and their relative proportions.
When the goal is to adjust a model for dilution, what matters is how much of the sample is not tumour, not which cells they are. Adjusting for one purity value instead of multiple cell-type fractions leaves your linear model with more degrees of freedom, so it can estimate the group differences more precisely.
The Repstress score was developed in small cell lung cancer. Seven of the 17 genes were included because they tracked neuroendocrine features in that cancer type. Those genes might behave differently in brain tumours. In fact, the original authors tested a 10-gene version without them, so I reran the analysis with it,keeping the original weights. Most results remained unchanged. However, the differences between DNA methylation clusters mostly disappeared, suggesting that part of the signal came from those seven genes.
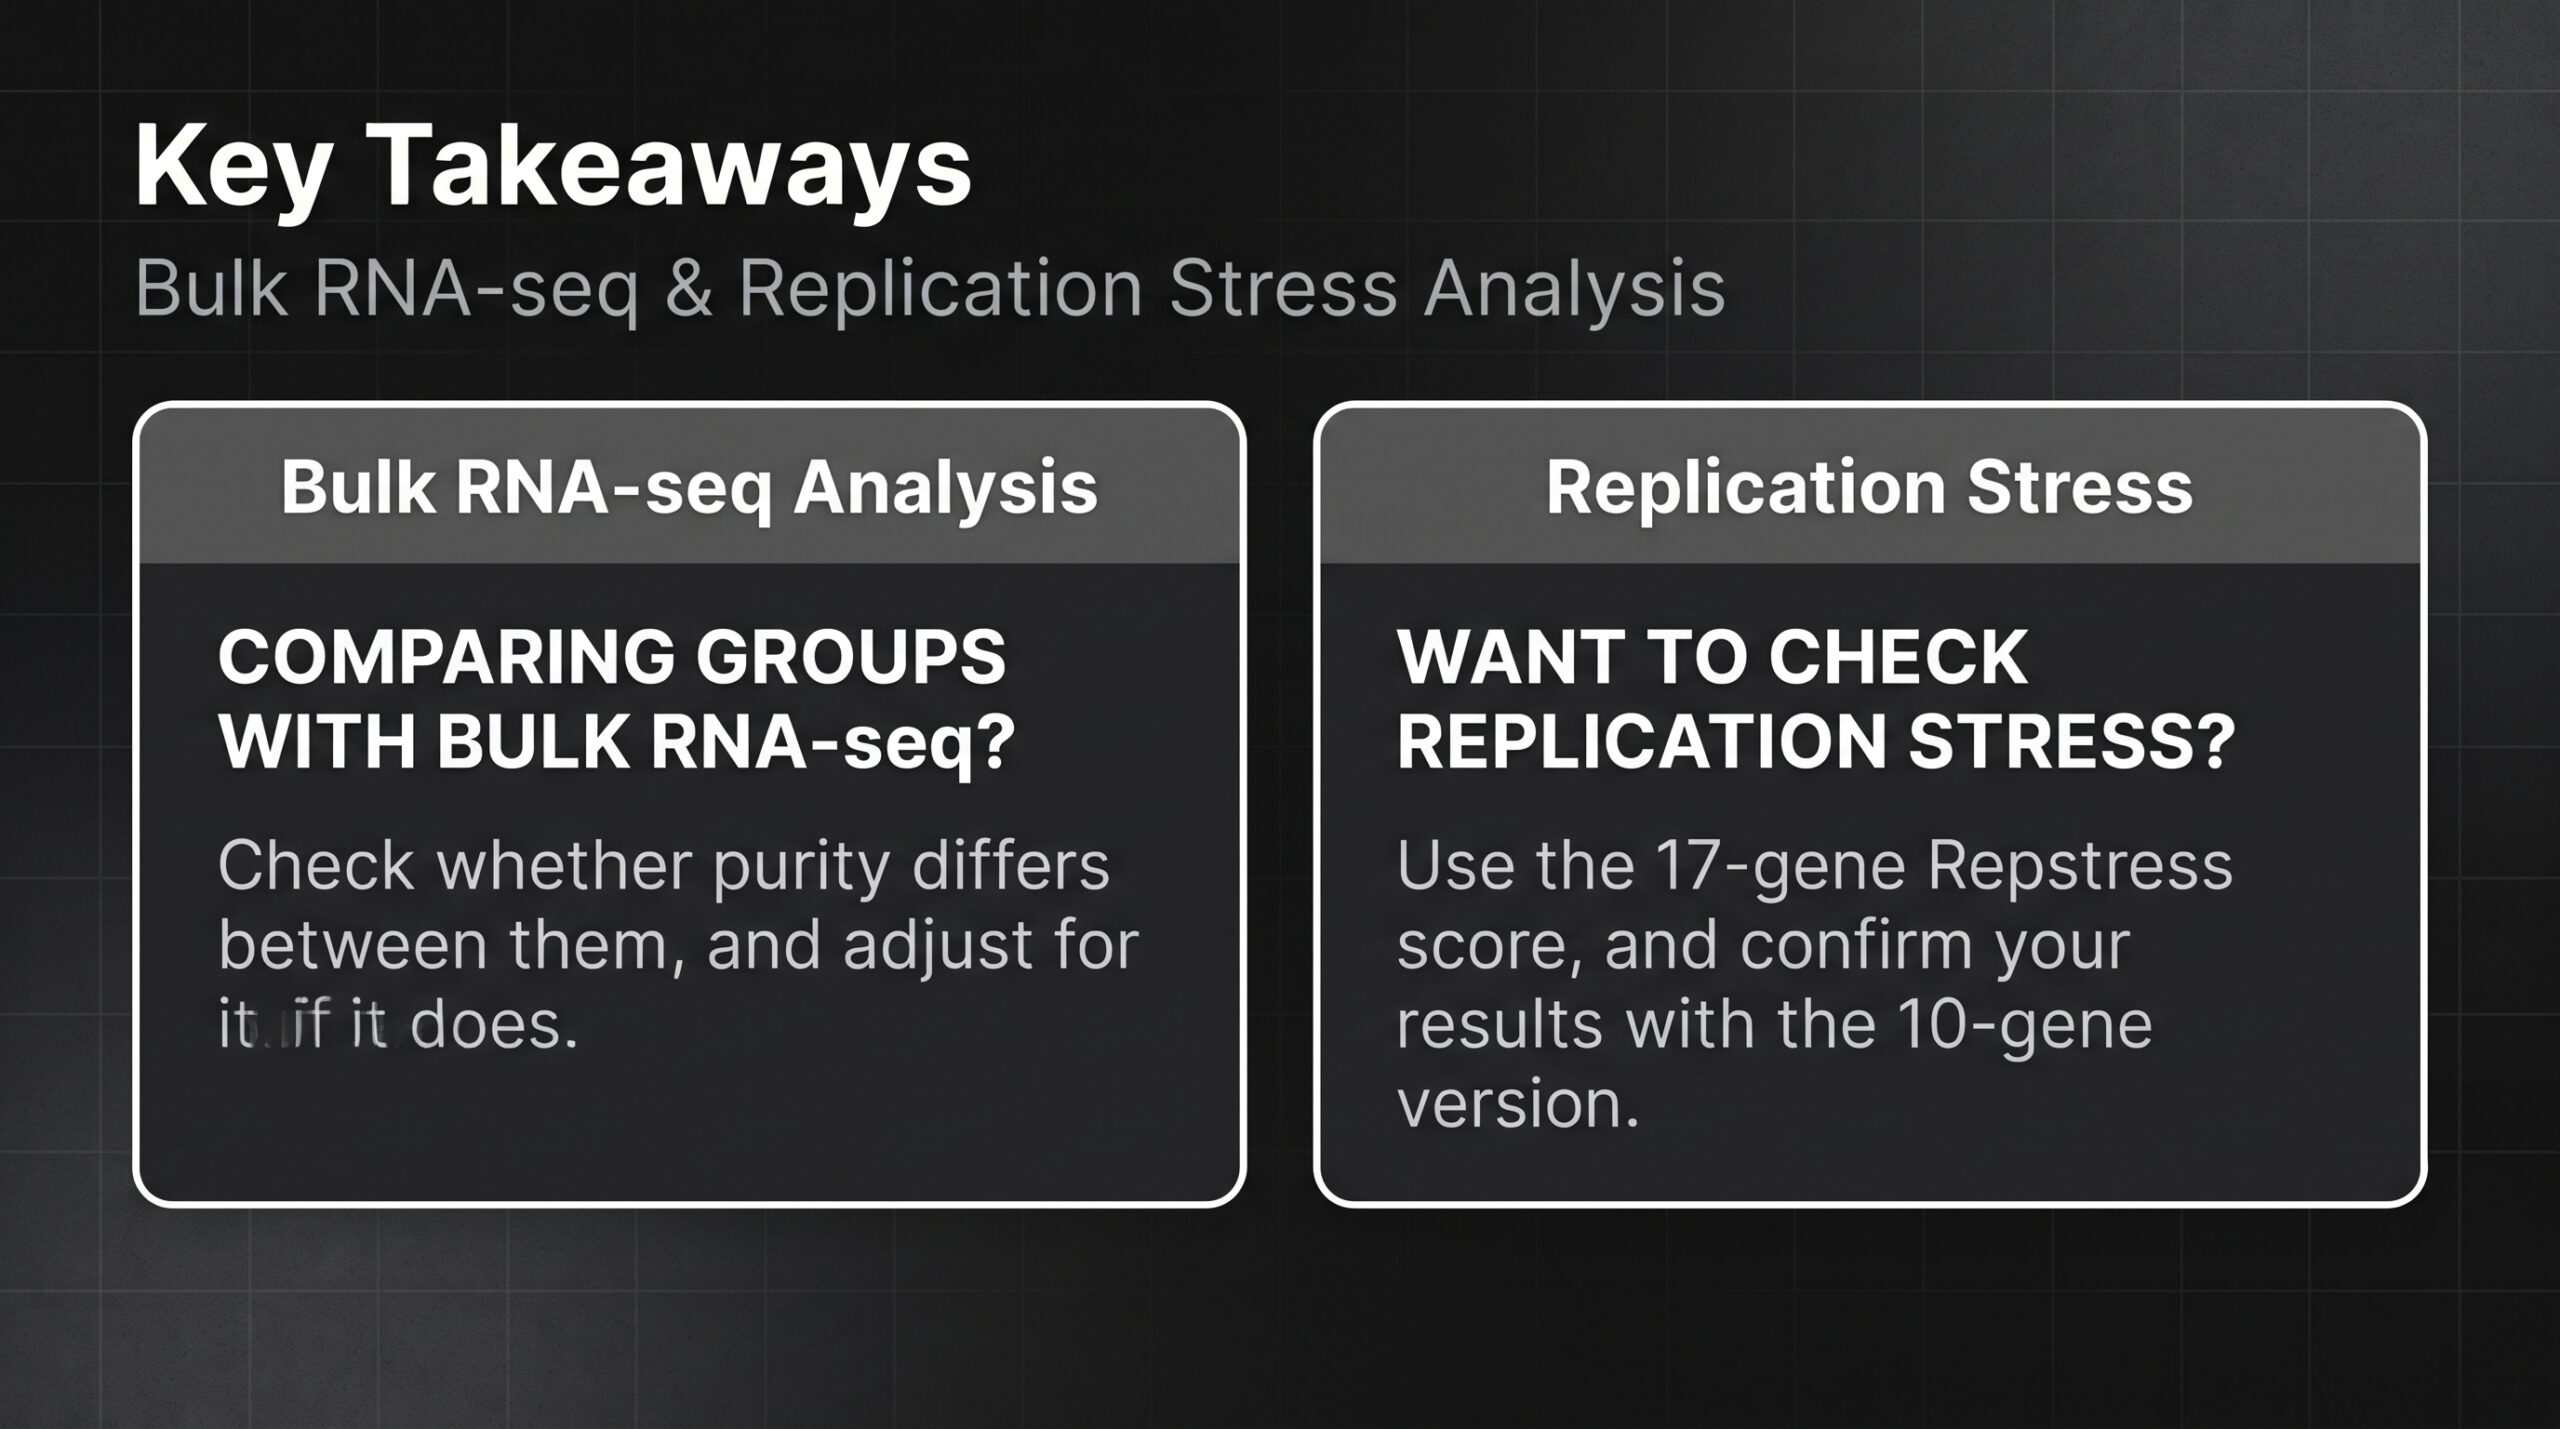
Takeaways
- Comparing groups with bulk RNA-seq?
Check whether purity differs between them, and adjust for it if it does. - Want to check replication stress?
Use the 17-gene Repstress score, and confirm your results with the 10-gene version.
Bibliography
1. N. Takahashi, S. Kim, C. W. Schultz, V. N. Rajapakse, Y. Zhang, C. E. Redon, H. Fu, L. Pongor. Replication stress defines distinct molecular subtypes across cancers. Cancer Research Communications, 2022 June, 2(6).
2. GitHub – Kai Aragaki – ESTIMATE tumor infiltration, the tidy way.
Cover image credits: Sebastian Kaulitzki / Adobe Stock