What is aPEAR (Advanced Pathway Enrichment Analysis Representation)?
It’s an open-source R package used in bioinformatics to automate the visualization and interpretation of Pathway Enrichment Analysis (PEA) networks.
Why use aPEAR?
A gene usually belongs to more than one pathway – often dozens. When you run enrichment analysis, you don’t get a short list back. You get hundreds of overlapping, redundant pathways, and sorting through them usually takes longer than actually interpreting the results. aPEAR turns that into one clean, readable network, automatically.
aPEAR vs. other PEA Methods
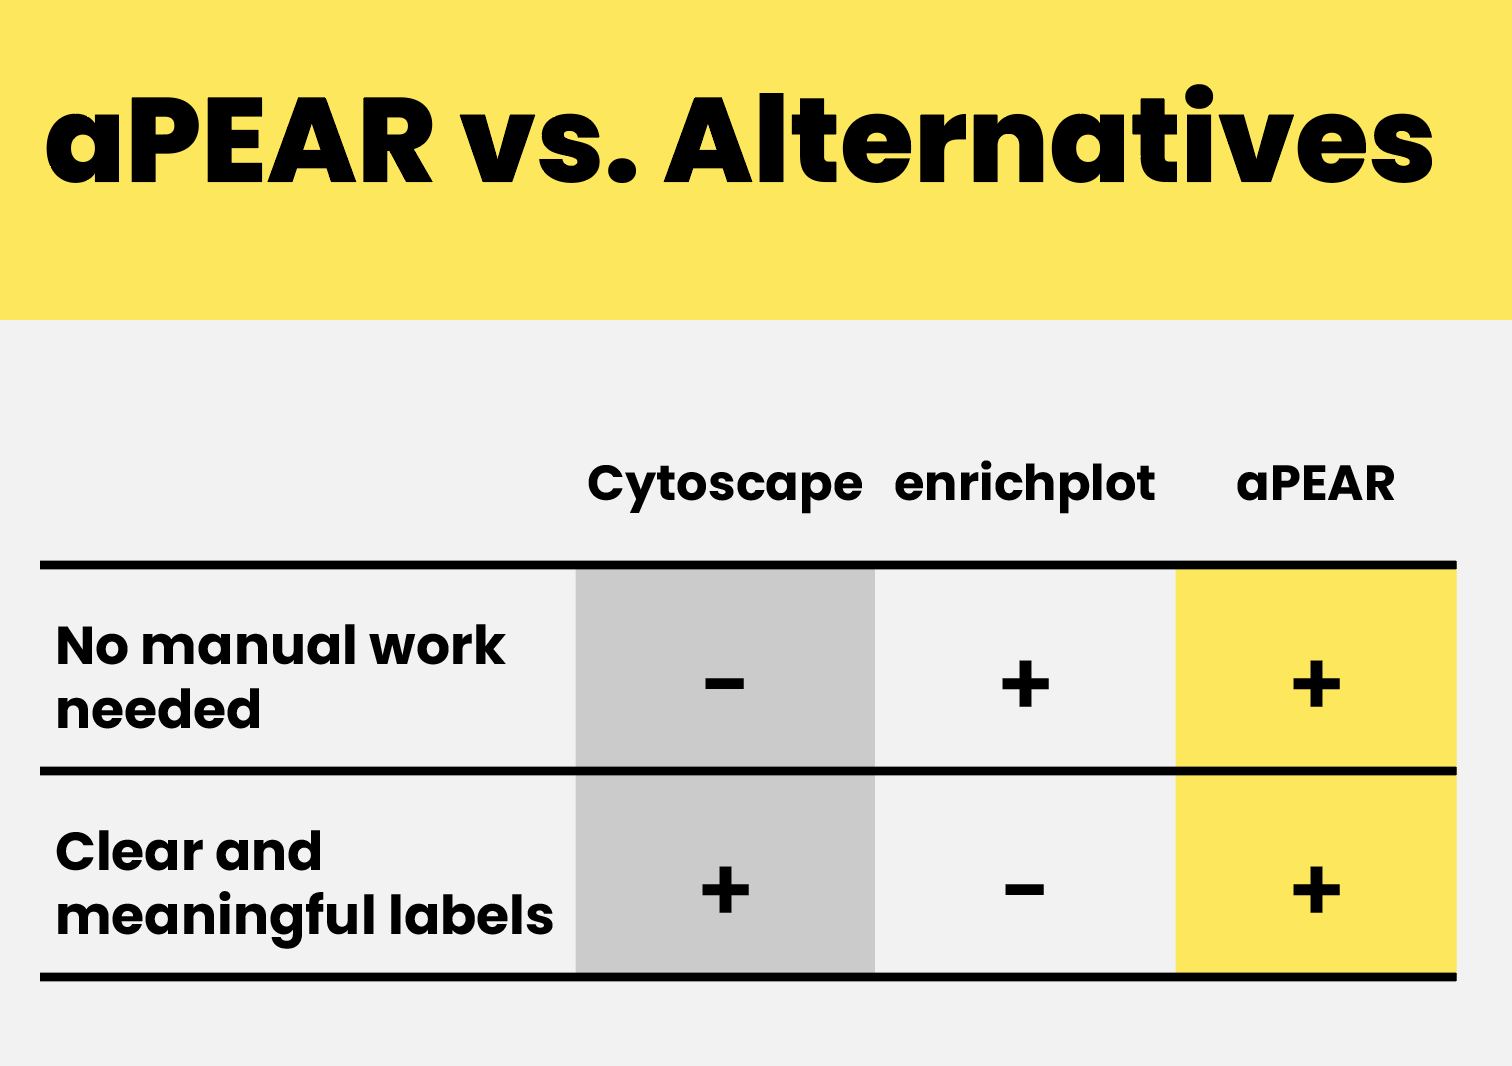
Cytoscape gives you clear labels, but building the network by hand takes time. The enrichplot automates the layout, but the labels are just word clouds that don’t say much about the underlying biology. aPEAR does both: it automates the layout and gives you labels grounded in real biology.
How aPEAR groups pathways
It measures gene-set overlap between every pair of pathways, then groups the similar ones together. By default, it uses the Jaccard index to measure similarity and Markov clustering to group pathways, though cosine/correlation similarity and hierarchical/spectral clustering are also available.
How clusters get their names
Each cluster is scanned with network analysis (PageRank or HITS) to find its most central, best-connected pathway. That pathway’s name becomes the cluster label. So, the name comes from biology itself, not from counting words.
Is it statistically validated?
The default settings weren’t a guess. Before locking them in, the team ran 180 cluster-quality tests across 10 real-world datasets, checked with the Dunn, Silhouette, and Davies-Bouldin indices. Jaccard similarity paired with Markov clustering came out on top, which is why it’s the default.
Do I need to be an R expert to use it?
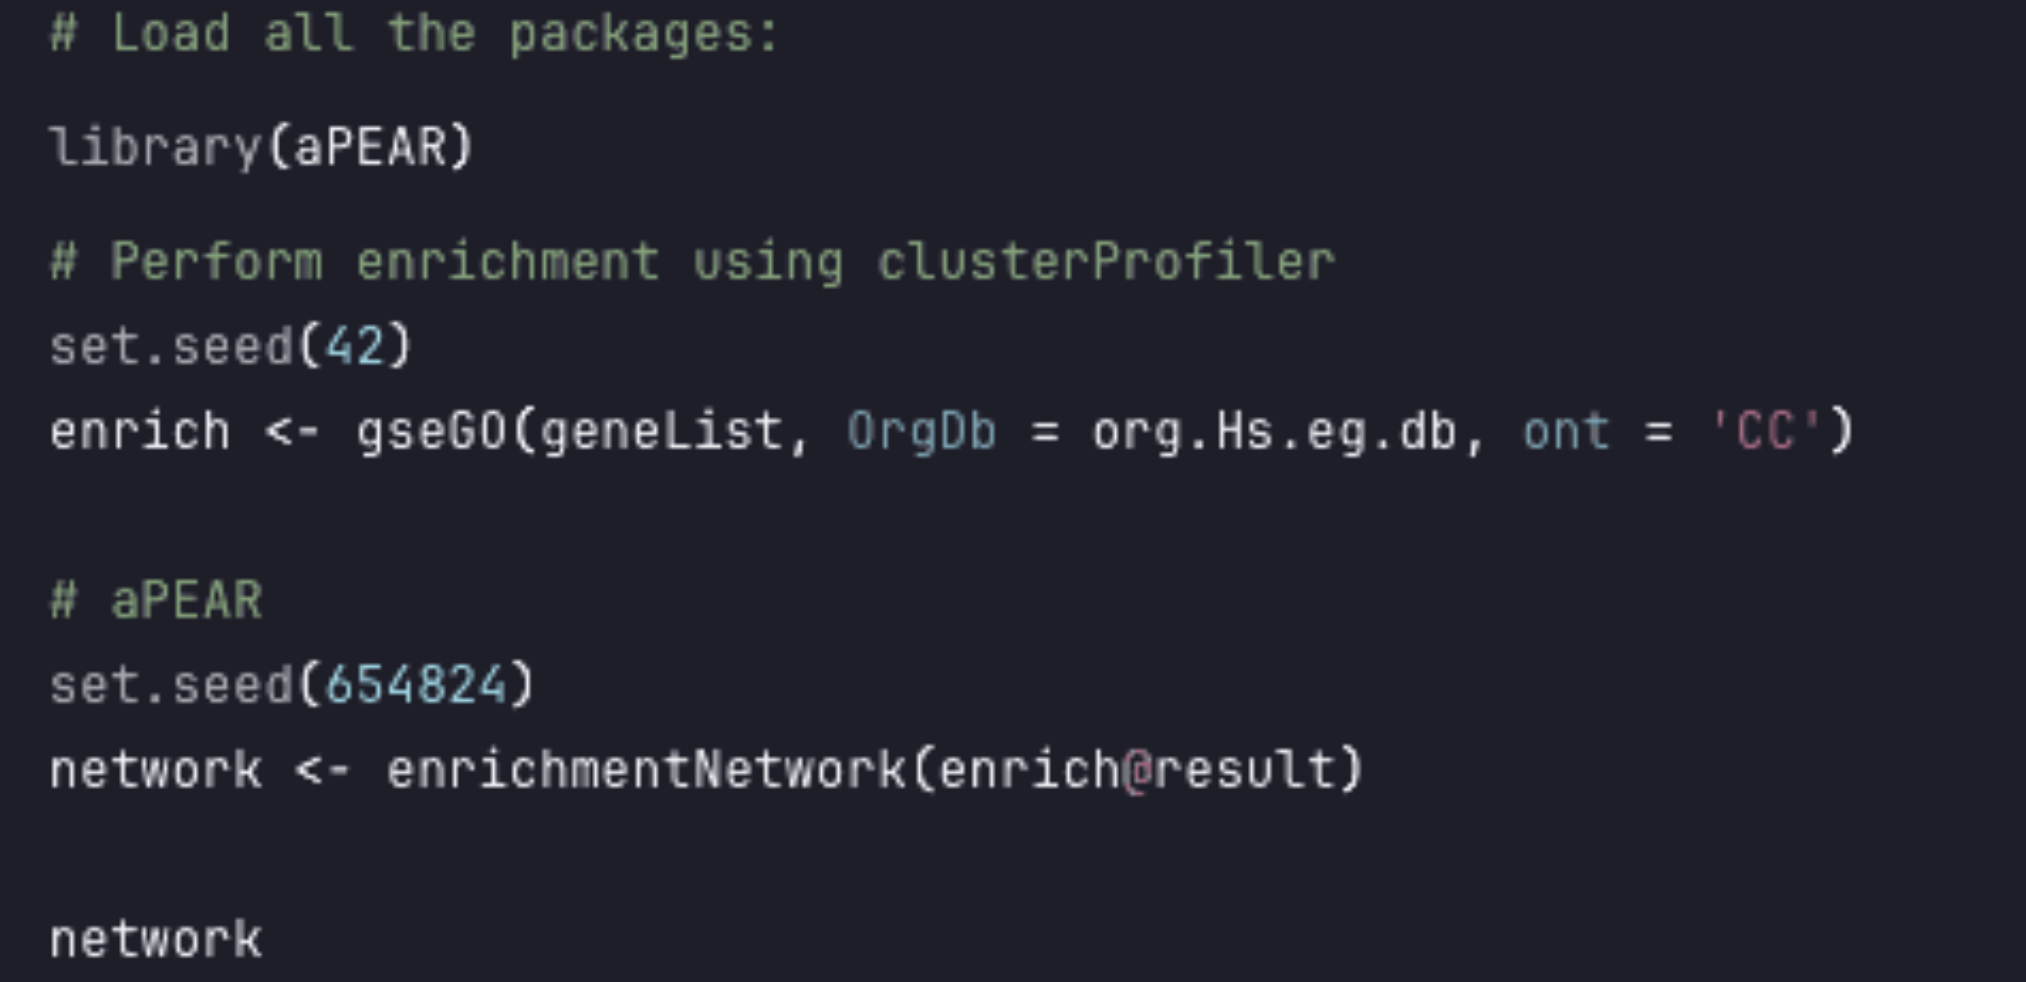
No. One function does the work. If your enrichment results are formatted correctly, aPEAR takes it from there – no extra parameters required. It works with results from tools you’re probably already using, like clusterProfiler.
It’s free, open-source, available on CRAN and GitLab.
Find the full article in the Bioinformatics journal.
Cover photo credits: Atlas (AdobeStock)